Freshwater is Fresh

Posted on

I recently read the proposed amendments to freshwater management in NZ. Those amendments demonstrated a clear intention by the government to allow increased pollution of freshwater in NZ. It just needs an economic justification.

They are trying to do it by using aggregate measures which means some water bodies can become highly polluted provided they can be offset by unpolluted water. They also intend to constrain regulation by economic justifications. What this means is that you can pollute if it is not economically viable to stop. It is also OK to pollute providing the water can be used for recreation purposes such as sports like water skiing or rowing. That does not include swimming or drinking. It takes no account of other natural users of the water such as fish, birds and animals. Unless it is a cow as that is an economic unit. These very are toxic ideas.

There is no good reason why pollution of water is acceptable. Economic reasons are not good reasons to pollute the environment which is the current and future generations life support systems. If your business is not economical to run without harm to the environment then it is not a viable business.

Below is the guts of the submission

Having regulations in place that minimise human activities impact on the environment is critical to New Zealand’s future in a number of ways including its pure brand and having quality resources for future generations. Maintaining the quality and quantity of freshwater in New Zealand is part of that.

A minimum standard is all that will be achieved by commercial interests. That standard for all water bodies should be within natural variations of freshness as scientifically determined.  Freshwater should be just that. If it is contaminated then it is not fresh. Contamination includes extra heat and any pollutants that move it away from fresh. Fresh condition is as it would result from rain if not polluted by human activity. The contaminator is responsible to not contaminate. The councils are responsible to enforce and advise on how to achieve freshwater quality when it is used in human activity.

There is no acceptable reason why any water should enter the environment polluted by human activity. An aggregate measure of freshness of water quality means that some water bodies can be highly polluted while others are not. I would object to the concept of aggregation of quality and quantity measures for an area.

Recognising that water is required for human and industrial purposes it is the users (those benefitting from the use) that must ensure that the water when returned to the environment is contaminant free and in fresh condition.

Levels and quality of water should not very significantly from the natural cycles. The allowable variation will need to be scientifically determined locally at the expense of the applicant. Changing these will impact on the environment which needs to be maintained.

It may be necessary for high level users to develop their own catchments independent of natural ones to collect sufficient water and recycle that water but any such development would need to be checked to ensure that there was minimal environmental impact.

It is recognised that some human and industrial usage is not complying with these constraints. Such users will need to be managed such that they come under constraint within a certain time frame.  Failure to do so will result in loss of rights to use the water and ability to carry out the activity.

Using an economic justification for pollution or inability to meet freshness requirements is not acceptable. It may never be economically justifiable or the time frame would be unacceptable. This means that the activity clearly is not sustainable so should be halted or constrained until a means is developed to use the water in a managed and sustainable way.

Pollution is simply externalising the costs to future generations and in some cases to current society. It is the government’s responsibility to protect and enforce the protection of future and current generations’ interests and the environment on which they depend. Fresh water is a fundamental and non-negotiable right and need of people and the environment.

This submission does not address the specific questions, as that is the domain of experts and those paid to do the work. I would expect that they will be able to answer the questions based on this submission. However it does outline principles that as a citizen I would expect a government to uphold. Again in summary

  • Fresh is fresh for any water body, not in aggregate.
  • Users are responsible to ensure that fresh water is returned to the environment in natural (fresh as in rainwater) quality and quantity.  That is a minimum. Anything less is pollution.
  • It is not acceptable to externalise costs to future or current generations of society or parties other than the users and those that benefit.
  • Economic constraints and justification are unacceptable for pollution.

I would hope the minister would send the proposal back for redrafting to ensure the above principles are applied.

Yours sincerely and hopefully (of good governance)

Flip

PS Pages related to the proposed amendments

https://www.greens.org.nz/takeaction/submissionguides/rivers-are-swimming

http://blog.greens.org.nz/2014/01/31/help-save-our-rivers-make-a-quick-submission/
Gini. A measure of inequality.

Posted on

I did a post on how a UBI would address inequality here

UBI: Addressing Inequality

It turns out I derived something that is already known as a measure of inequality call the Gini coefficient and the Lorenz curve. My results were based on individual incomes rather than households but essentially it gave the same result.  A lower Gini coefficient is better and represents a more equal society. It is a recognised way of measuring and comparing inequality between countries, changes in equality overtime and for the effects of taxation proposals.

http://en.wikipedia.org/wiki/Gini_coefficient#US_income_Gini_indices_over_time

http://en.wikipedia.org/wiki/Gini_coefficient

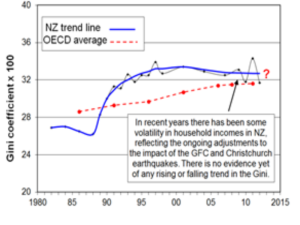
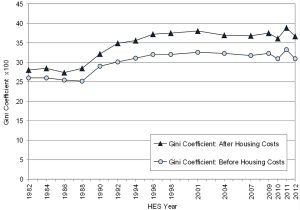
Below is the graph for NZ over time.

Gini Coefficient2

Source Child Poverty Monitor: Technical Report.

The graph speaks for itself but to state the obvious, successive governments in the last 35 years have not done much to shift inequality since rogernomics and the 1987 crash which raised it dramatically. Boy was that ever a hand out to the wealthy. It helps explain why there is such a feeling amongst older people that society was better in the past.

There is no reason to think it is OK to have a coefficient of above 30? Surely we’d want to reduce this? Why does NZ not target a Gini coefficient of say around 20 and tax and adjust social and economic policy to achieve that level. This is just as valid measure of a country’s performance as any other measure and infinitely more preferable for society than many of the obscure measures currently used. We currently control for inflation so there is no reason not to control for inequality. The effects of controlling for this would be numerous but maybe incomes would adjust to being fairer as it would be known that ridiculously high incomes would simply be redistributed via tax more fairly. Fiddling with the OCR clearly only goes so far in managing the economy.

I’d suggest that governments performance in addressing inequality can be measured thus. I’d expect the next government to make a significant shift in this before I believe they are interested in address inequality. Clearly the last labour government failed to address inequality and nor has this one. If a left government wants to have power in NZ and genuinely wants to fix the 1980’s shafting of NZ society they better do something about it.

The debate is carried on here

http://www.stuff.co.nz/national/politics/9672616/Inequality-Is-it-growing-or-not

Other links

http://www.parliament.nz/en-nz/parl-support/research-papers/00PlibCIP181/household-incomes-inequality-and-poverty

A report that is worth a read as it frames the debate in NZ is reference below.

http://www.msd.govt.nz/about-msd-and-our-work/publications-resources/monitoring/household-incomes/

Gini Coefficient

In it they seem to imply that the OECD average is an acceptable level. Comparatively to US, UK and Australia we have a more equal society. Why anyone thinks we are like those countries in the 21st century or want to be like them is beyond me. Targeting the OECD average is hardly aspirational for NZ society. The rising inequality levels are unacceptable in a civilised country for a whole lot of reasons. The greater the measure (like the Gini coefficient) of the equality of a society  the greater the level of civilisation. NZ can lead the world in civilisation as opposed to descending into the barbaric and competitive nature of the US economic system and its followers. The politicians who articulate a vision of a more equal society to me are worthy of voting for.

UBI: Addressing Inequality

Posted on

Income equality is one measure that can be used to indicate the equality of a society. I have analysed the 2011 income distribution and show how a UBI (Universal Basic Income) can create greater income equality. The details of the UBI and its benefits are detailed in other places. Quite a lot of discussion has occurred regarding the benefits and pro’s and con’s of it as well.

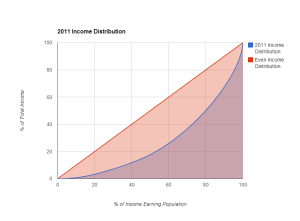
2011 Income Distribution

In the graph below the red line would be what the income distribution would be, when 50% of the income earning population received 50% of the income, 10% received 10% etc. In other words, if the income was evenly distributed among the population.

The blue line represents the actual NZ distribution of income in 2011.

The stepper the blue curve and the less area under the curve the more uneven the distribution of income. The closer it moves to the red line or the greater the area under the curve the more even the distribution of income. The steeper the curve the more income is earned by less of the population and less even the income distribution. By measuring the area under the blue line and subtracting it from the area under the red line you get a measure of inequality. (The area shaded in red). An index if you like.

Table of % of Population earning less than the income band per annum.
% of Population  Approx Income Band
 20%  $11k
 40%  $19k
 50% $25k
 60%  $34k
 80% $54k
 95% $93K
2011 Income

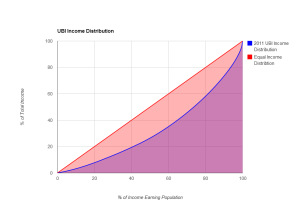
UBI Income Distribution

Applying a UBI of $9080 and a flat tax rate of 33% the curve looks like this. This has been selected based on analysis done by Perce Harpham and details can be found here https://dl.dropbox.com/u/92595908/UBIintroduction.doc. Alternatives schemes can be selected and various options are possible. This spreadsheet https://dl.dropbox.com/u/92595908/UBIspreadsheet.xls enables the experimenting with different levels of UBI and assumptions. Further comments are here http://www.inequality.org.nz/universal-basic-income-how-it-could-work-in-nz/.
UBI Income

Other Scenarios and Comparisons

The table below offers a comparison of other scenarios. The closer the Equality Index % is to 100% the more even the income distribution.
The 2007 scenario shows historically what the equality index was.
The 25K scenario is what would happen if the first $25K of income was tax free.
The UBI scenario gives people a UBI of $9,080 tax free and sets the tax rate at 33%.
The Flat scenario is what would happen if all income was charged at 33%.
Note the change in government tax income and the equality % change between the different scenarios.
The 25K and  UBI scenarios alter the government funding so would need to recover that by other means assuming no loss of government service.
For the UBI an asset tax is proposed to fund it and savings would result from the simplified system. There would be less bureaucracy in the administration and management of benefits.
Income Earning Population 3,319,500
Equality Index Income ($m) Tax ($m) Tax take change from 2011 ($m) UBI Cost ($m) Government Income Change from 2011
2007 52.37% 106,085.50 25,192.10 1,039.60 1,039.60
2011 53.00% 121,153.40 24,152.50 0.00 0.00
25K 57.21% 107,525.15 13,628.25 (10,524.25) (10,524.25)
UBI 64.69% 112,441.12 39,980.62 15,828.12 31,268.34 (15,440.22)
Flat 53.00% 81,172.78 39,980.62 15,828.12 15,828.12
The government income change for the UBI is not -$15.44 billion as the actual population is different to the income earning one.
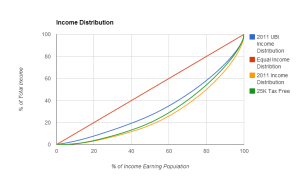
From the graph below it can be seen that the 25K tax free scenario reduces inequality a little and benefits middle to high income earners more than low income earners. The UBI has a much more significant effect spreading the benefits more evenly among the population.
Scenario

For more details on the UBI scheme refer to this post.

http://blog.labour.org.nz/2012/05/31/an-interesting-idea/

Some actual real thought has gone into this UBI proposal. It is practical, simple and would actually work. It includes thoughts on the impact and how it would be paid for and actually removes complexity from the system unlike the fiddles by previous governments. I have not explained all the details but they can be found in the links. There are still some issues to resolve and it is impossible to assess all the impacts but nothing exists that amounts to a show stopper. The consequence of increasing the UBI is that it will increase the taxation level but the proposed amount is a start and can be sold politically and allows for further adjustments in the future once the benefits begin to accrue. 

If a party sees inequality and its consequential social issues as a major issue and I think lots of people do, then here is something practical that can be done to address it with some real benefits and would improve the quality of life for most New Zealanders.